
Exclusive analysis
Affordability 'easing' isn't evenly felt — here's the map
The FCA's push on stress-test flexibility has given lenders room to offer tens of thousands of pounds more. But new analysis of major lender calculators shows the gains fall almost entirely on mid-income borrowers outside the South — leaving first-time buyers in London and the South East no better off.
October 2026
When the Financial Conduct Authority began signalling flexibility on mortgage stress-test rules in late 2024, the mortgage industry — and would-be buyers — took notice. The standard affordability assessment, which stress-tests borrowers at 3 percentage points above the reversion rate, had long been blamed for suppressing borrowing capacity at a time when house prices had outpaced earnings in almost every UK region.
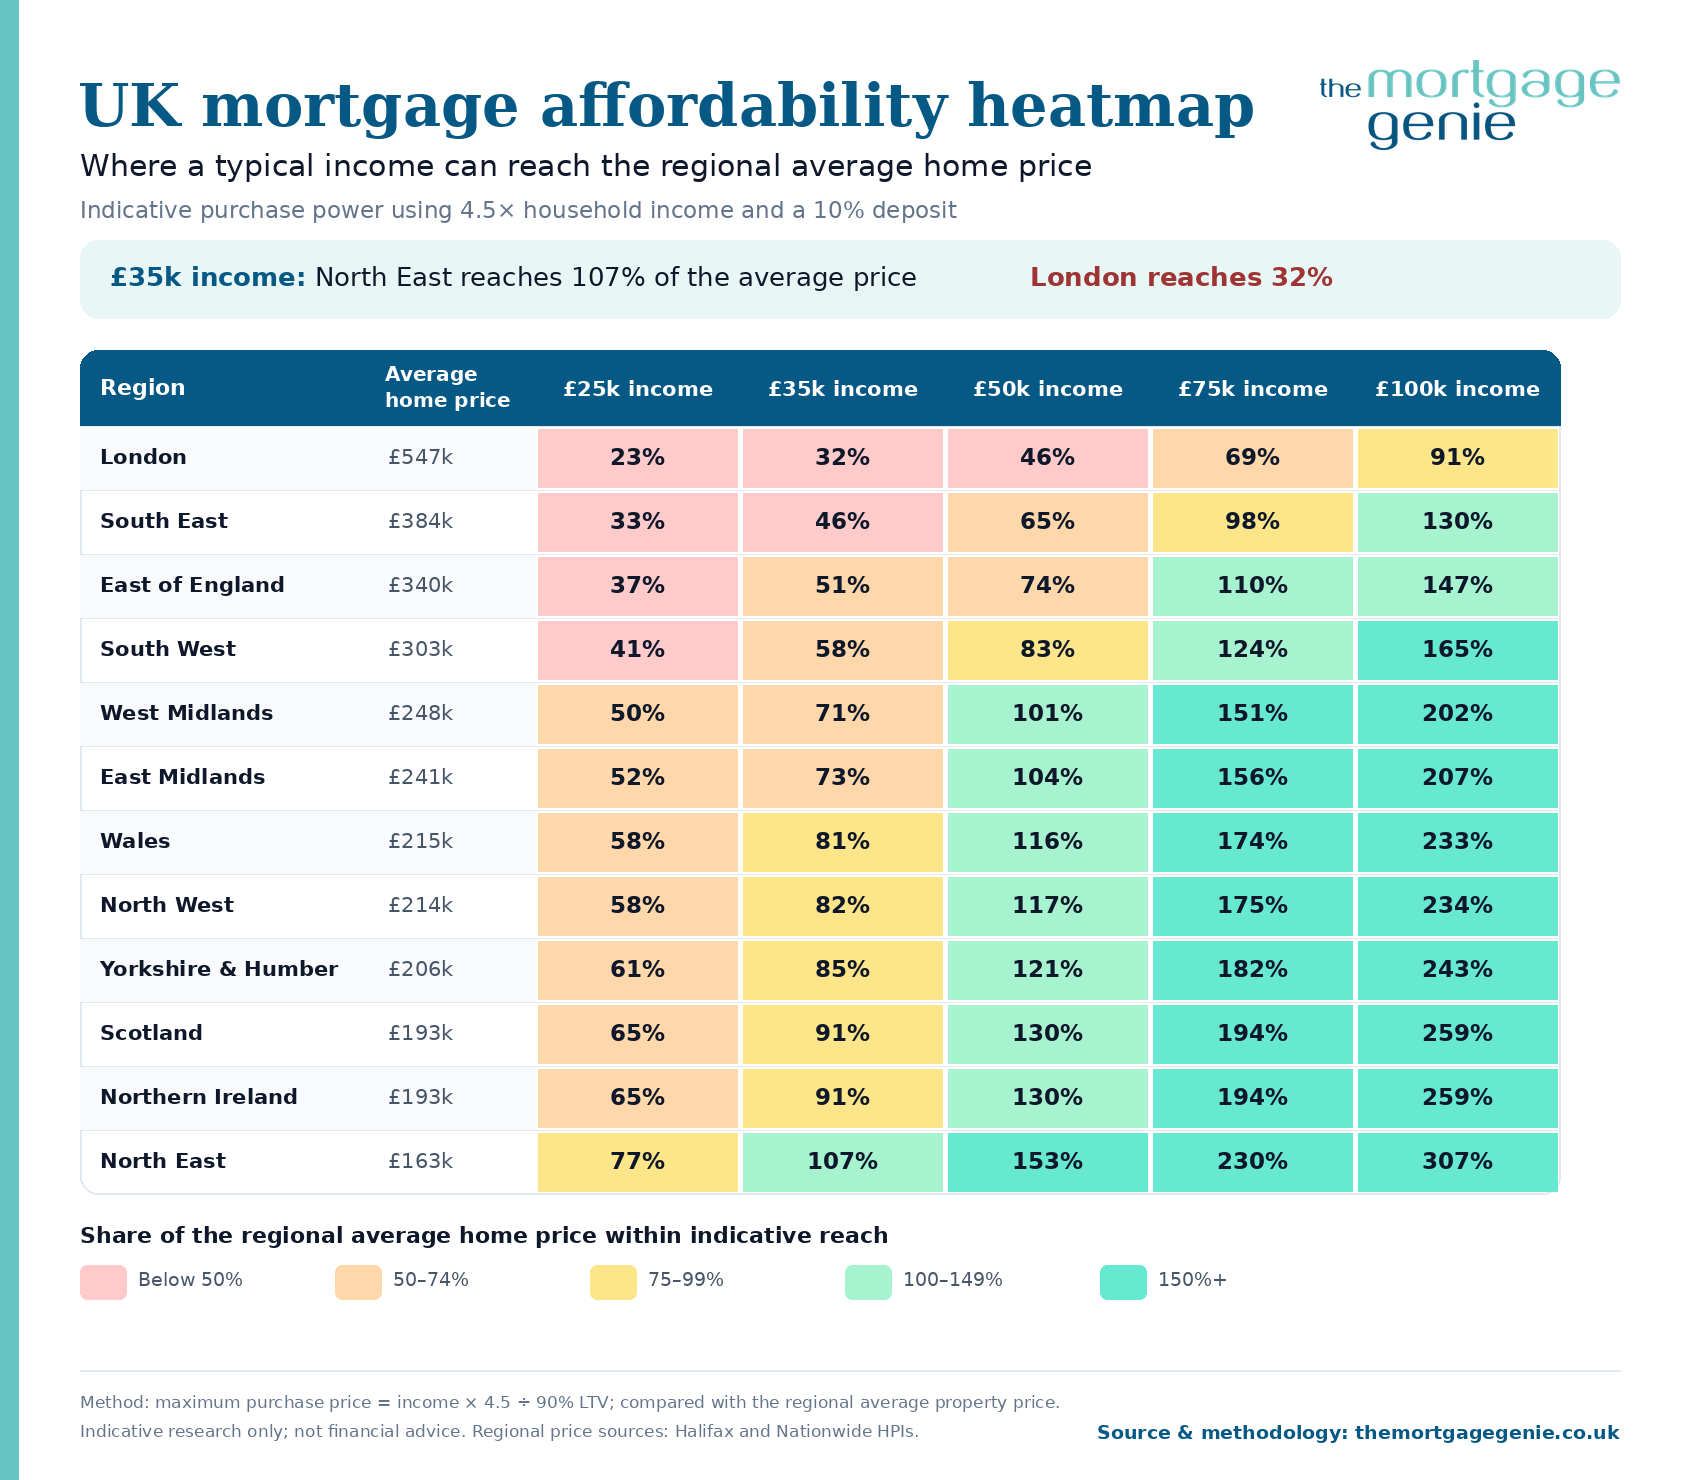
But the question that lenders, intermediaries, and policymakers have been slow to answer publicly is: who actually benefits, and where?
To find out, we ran a systematic ‘mystery shop’ of the affordability calculators of eight major lenders — Halifax, Nationwide, HSBC, Barclays, NatWest, Santander, Lloyds, and Skipton — across five income bands and three borrower profiles, and mapped the results against average regional house prices and local price-to-income ratios.
The conclusion is stark: the extra headroom is real, but it is geographically targeted. For households earning £25,000–£50,000 and looking to buy in the North, the Midlands, or Scotland, a more generous stress-test assumption can move the needle by £20,000–£50,000 — enough, in some markets, to cross the threshold from ‘can’t afford’ to ‘can.'
In London and the South East, where the average home costs 8.5–14 times the average income, those same extra tens of thousands are close to irrelevant.
“The extra headroom is real, but it is geographically targeted. In London, those extra tens of thousands are close to irrelevant.”
The FCA Reform: What Changed
The FCA’s mortgage market reform package, which took effect in stages through late 2025 and early 2026, moved the regulatory framework away from prescriptive stress-test floors toward an outcomes-based model aligned with the Consumer Duty. In practical terms, this gave lenders discretion to assess affordability on a more holistic basis — factoring in borrower-specific circumstances, rather than applying a blanket rate shock.
In practice, several lenders have responded by adjusting their income multiplier assumptions upward — from the traditional 4.5× ceiling toward 5× or 5.5× for qualifying profiles. Skipton Building Society and Halifax, for instance, will now lend up to 5.5× salary for employed borrowers with clean credit. Nationwide reaches £600,000 for a £100,000 couple, outpacing most peers.
The FCA has been careful to frame this not as a loosening of standards, but as a removal of unnecessary rigidity. The FCA’s language has consistently emphasised ‘proportionate’ assessment and ‘genuine flexibility’ — a framing that allows lenders to compete on stress-test assumptions without, in theory, worsening consumer outcomes.
The Data: Where the Gains Land
Our analysis compared maximum loan offers across eight lenders, five income levels (£25k to £100k couple), and three borrower profiles (employed, self-employed, with debts). We then mapped those maximum loans against regional average house prices from the Halifax and Nationwide HPIs and price-to-income ratios derived from ONS ASHE earnings data.
Table 1: Regional price-to-income ratios and purchase power tier
| Region | Avg price | P/I ratio | Tier |
|---|---|---|---|
| London | £547,000 | 12x–14x | Highly unaffordable |
| South East | £384,000 | 8.5x–10x | High-cost South |
| East of England | £340,000 | 8x–9x | High-cost South |
| South West | £303,000 | 8x–9x | High-cost South |
| West Midlands | £248,000 | 6x–7x | Moderate |
| East Midlands | £241,000 | 6x–7x | Moderate |
| North West | £214,000 | 5x–6x | More affordable |
| Yorkshire & Humber | £206,000 | 5x–6x | More affordable |
| North East | £163,000 | 4x–5x | Most affordable |
| Wales | £215,000 | ~5.9x | High affordability |
| Scotland | £193,000 | ~5.3x | High affordability |
| Northern Ireland | £193,000 | ~4.6x | Most accessible |
The standard mortgage cap of 4.5× income means a single earner on £35,000 can borrow £157,500 on the most conservative lender, or £192,500 on the most generous. In the North East, where the average home costs £163,000, that spread is decisive: the more generous lender unlocks the market; the more conservative one requires a deposit that most first-time buyers cannot accumulate.
In London, that same spread — £35,000 in headline terms — is noise. The average home costs £547,000. A single earner on £35,000 would need to borrow 15.6× their salary to buy without a substantial deposit. No amount of stress-test flexibility changes that arithmetic.
Table 2: Maximum mortgage offer by lender and income — employed borrower, 25-year term, no debt
| Lender | £25k income | £50k income | £75k income |
|---|---|---|---|
| Halifax | £137,500 | £275,000 | £412,500 |
| Nationwide | £112,250 | £224,500 | £450,000 |
| HSBC | £112,250 | £275,000 | £412,500 |
| Barclays | £118,661 | £252,000 | £441,943 |
| NatWest | £111,200 | £262,500 | £431,250 |
| Santander | £107,296 | £222,500 | £333,750 |
| Lloyds | £137,500 | £275,000 | £412,500 |
| Skipton | £137,500 | £275,000 | £412,500 |
Lenders Competing on Assumptions — Not Just Rates
What is emerging in the post-reform environment is a subtler form of product competition than the market is used to. Historically, lenders competed on headline rate. Now, with the FCA’s outcomes-based framework giving room for discretion, they are increasingly competing on the assumptions that sit behind their affordability models.
Halifax and Lloyds Bank — both part of Lloyds Banking Group — consistently offer £137,500 to an employed borrower on £25,000. Santander, by contrast, offers £107,296 — a difference of £30,000 on the same borrower, same income, same day. Neither lender is violating any rule. They are simply applying different internal stress-rate assumptions within the space the regulator has opened up.
Skipton Building Society stands out for its consistency across income bands — matching Halifax at the lower end and maintaining competitive offers up the income curve. Its 100% mortgage product for renters, launched in 2023, suggests an institutional appetite for affordability-led innovation that others have been slower to match.
The risk, which the FCA has acknowledged in its consultation language, is that lenders use this flexibility to compete on assumptions in ways that could increase systemic risk — particularly if stress-test assumptions diverge sharply from actual rate environments. For now, the regulator appears satisfied that Consumer Duty obligations provide a sufficient backstop. Whether that holds in a rising-rate environment remains to be seen.
Self-Employment and Debt: The Hidden Fault Lines
The affordability gap between employed and self-employed borrowers represents one of the most significant — and least-reported — dimensions of the current market.
At £25,000 income, a self-employed borrower at Halifax or Lloyds is offered £104,765 — roughly £33,000 less than their employed equivalent. At £35,000, the gap narrows but persists. Only above £50,000 do the two converge. Nationwide applies a flat multiplier regardless of employment status, which makes it comparatively more attractive to self-employed borrowers at lower incomes.
Monthly debt commitments create a parallel cliff. NatWest’s affordability model is particularly sensitive: at £25,000 income with £800 in monthly debt payments, maximum borrowing collapses from £111,200 to just £19,800. Santander declines to offer any mortgage at all in that income-debt combination. These are not edge cases. They describe the financial profile of a significant share of UK renters who might otherwise be in a position to buy.
“At £25k income with £800 in monthly debts, NatWest’s maximum offer collapses from £111,200 to £19,800 — a drop of £91,400.”
Methodology
All lender calculator results were recorded on the same day in Q1 2026, using identical borrower inputs across each institution. Results represent indicative maximum loan offers and do not constitute formal quotations or commitments to lend. Figures should not be interpreted as implying lender approval of any specific borrower.
Regional price data is sourced from Halifax and Nationwide HPIs (most recent month available). Price-to-income ratios use ONS ASHE median earnings by region (2024 dataset). All figures are stated in nominal terms.
Borrowing amounts above £500,000 may be subject to additional criteria at certain lenders. Barclays results are presented as ranges reflecting their own calculator output format. Coventry Building Society and Leeds Building Society were excluded as their calculators require more qualified inputs not compatible with the standardised methodology used here.
DISCLAIMER: This page presents indicative affordability estimates for research purposes only. It does not constitute financial advice, a mortgage offer, or a regulated affordability assessment. Borrowers should consult a qualified mortgage adviser.